Climate niche factor analysis: a spatial approach to quantifying species vulnerability to climate change
Published in Ecography, 2019.
Rinnan DS and Lawler JJ. "Climate niche factor analysis: a spatial approach to quantifying species vulnerability to climate change." Ecography, 42(8) 1494-1503. https://doi.org/10.1111/ecog.03937
Download here
Abstract:
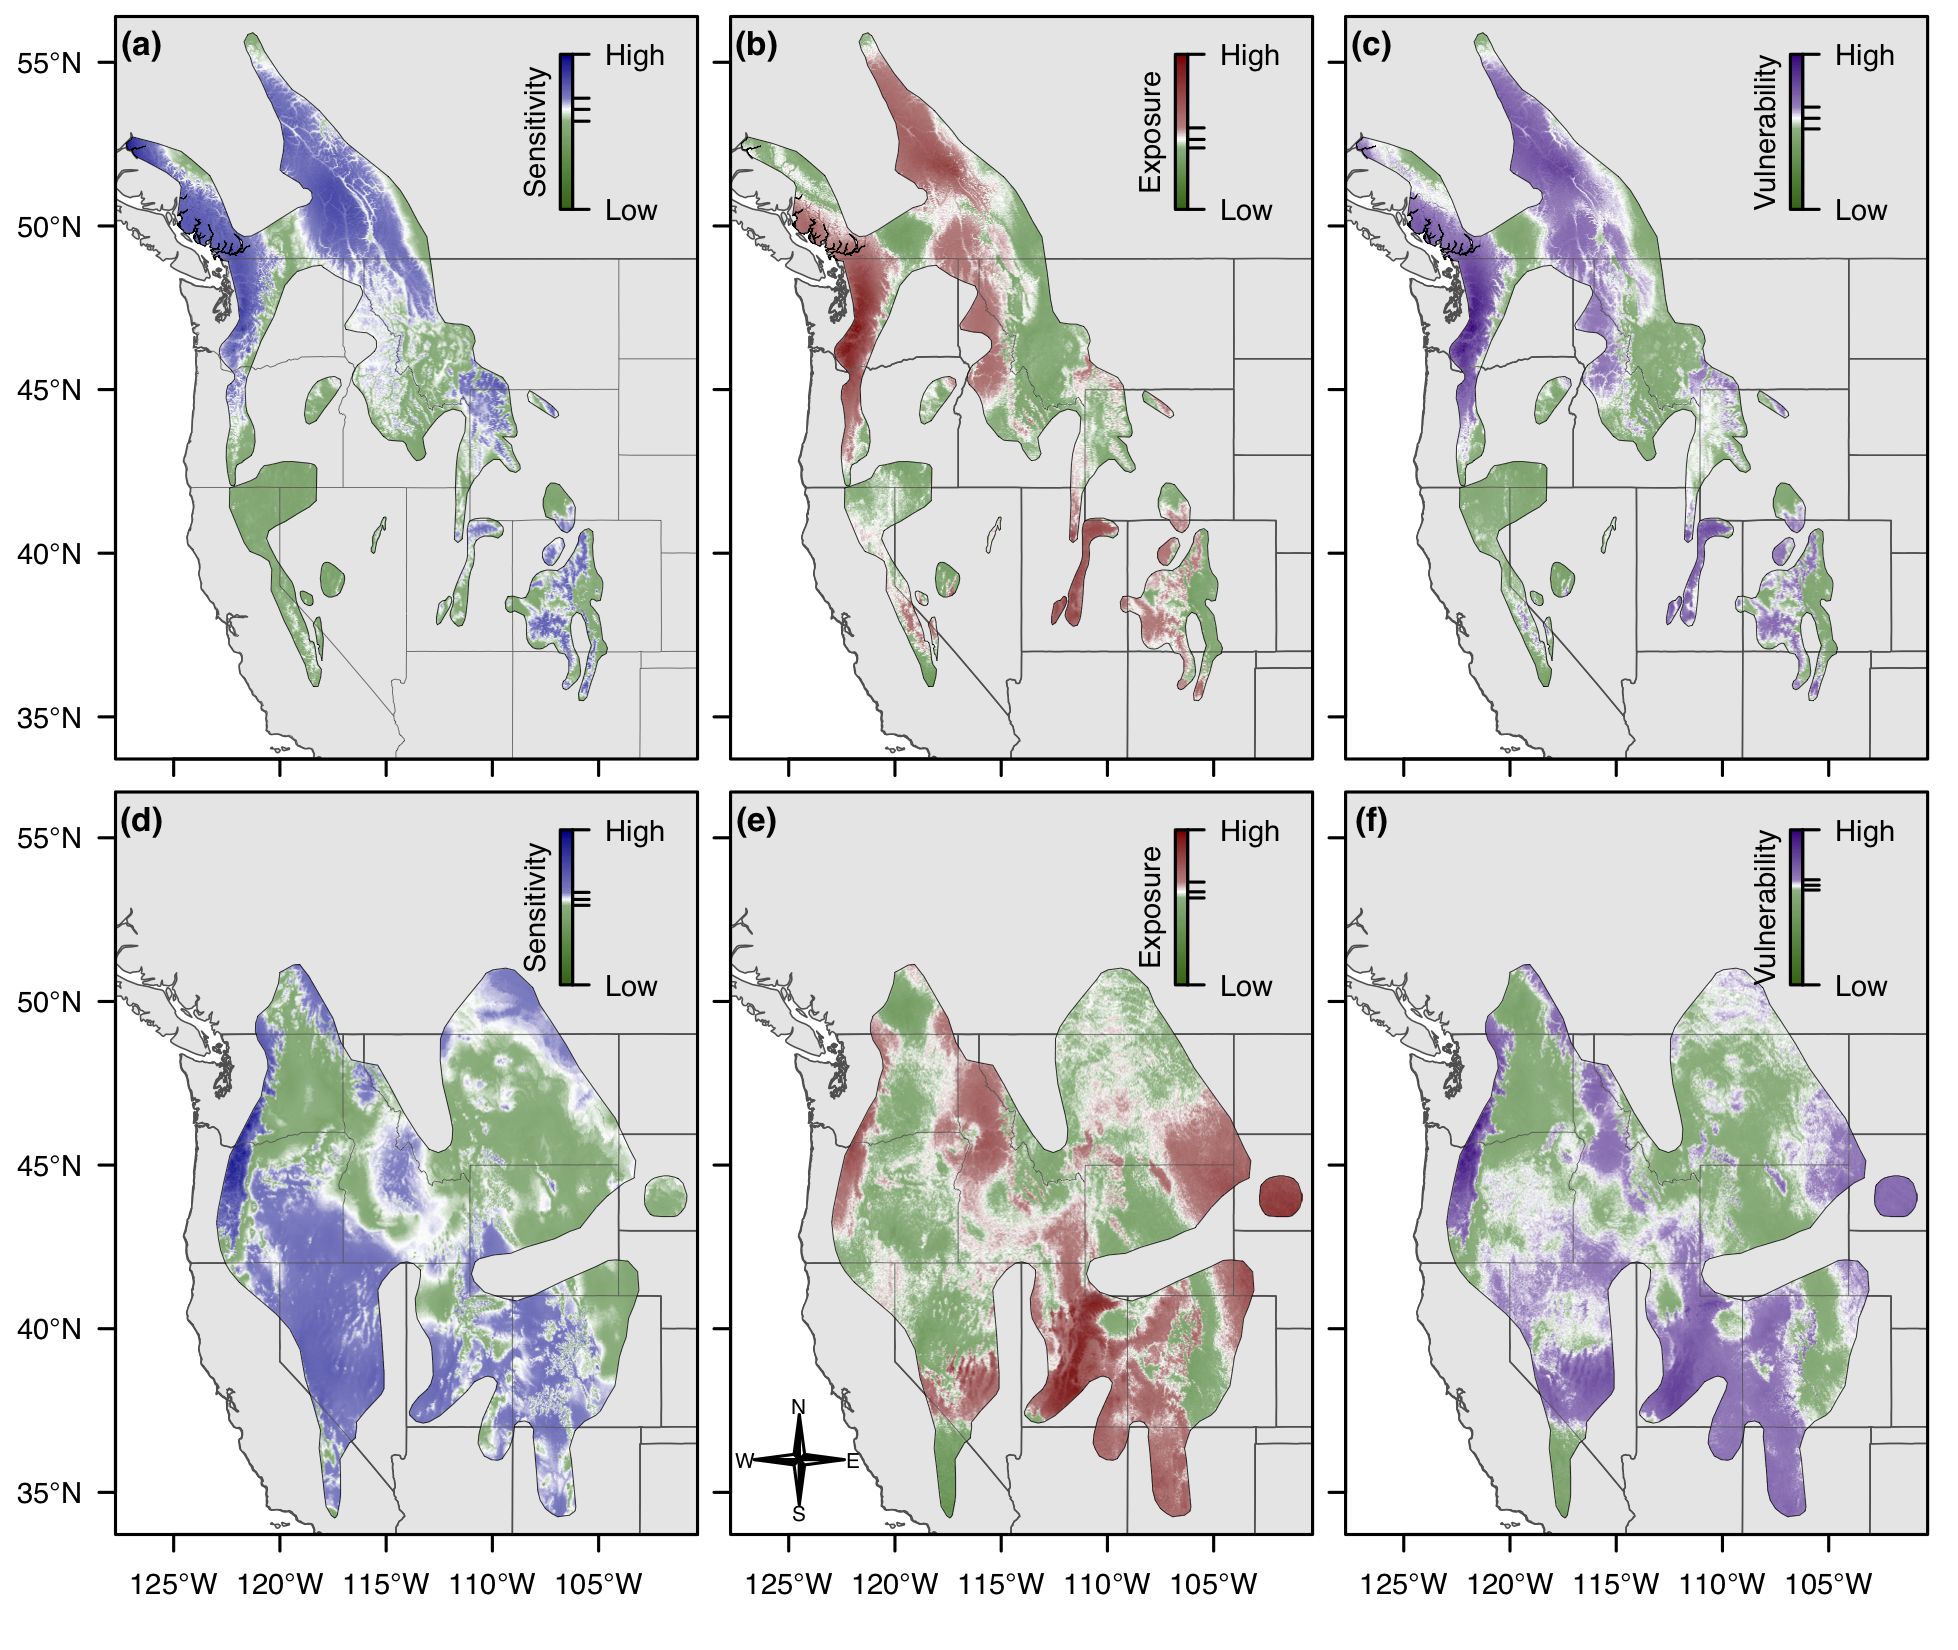
Climate change vulnerability assessments are an important tool for understanding the threat that climate change poses to species and populations, but do not generally yield insight into the spatial variation in vulnerability throughout a species’ habitat. We demonstrate how to adapt the method of ecological-niche factor analysis (ENFA) to objectively quantify aspects of species sensitivity to climate change. We then expand ENFA to quantify aspects of exposure and vulnerability to climate change as well, using future projections of global climate models. This approach provides spatially-explicit insight into geographic patterns of vulnerability, relies only on readily-available spatial data, is suitable for a wide range of species and habitats, and invites comparison between different species. We apply our methods to a case study of two species of montane mammals, the American pika Ochotona princeps and the yellow-bellied marmot Marmota flaviventris.

